Circulations Report
The Circulations report lets districts or sites see circulations broken down by checkouts, in-library use, and renewals for the past 10 years. District users can see results for the entire district or specific sites.
|
Note: Enriched Reports is only available for US-based Destiny Cloud customers. |
To access the report:
- In Destiny Back Office, select Reports > Enriched Reports.
Note: If Enriched Reports does not load, click Access Enriched Reports.
- Select Library > Circulations.
- Choose to view data in either a Bar Chart or Table.
Note: If you export data for a Bar Chart, you can only output the data in a summarized view. If you export data for a Table, you can output the data in a summarized view or in the current format.
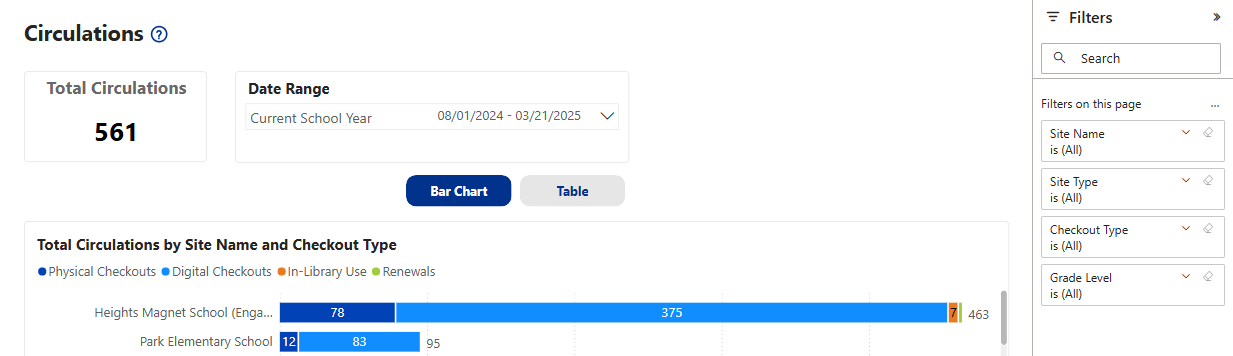
The page has the following data:
- Total Circulations: View for the district, selected site, or site type.
-
Date Range: Defaults to the current school year. Use the drop-down to select a pre-set time frame or custom date. To change a custom date, click
 . Enter a start and end date, or use the calendar to select dates.
 - Circulations by: Use any of the filters below.
Notes:
- At the district level, the default data is 'Total Circulations by Site Name and Checkout Type'. At the site level, the default data is 'Circulations - By Grade Level'.
- Copies that have been deleted, yet circulated, are included.
- Site Name or Site Type: At the district level, limit the report by site or site type. Site-level users only see their site.
- Checkout Type: Limit by physical or digital checkouts, in-library use, or renewals.
- Grade Level: Show all circulations by the selected grade. At the district level, to see circulations for all grade levels at a selected site, use the Click to turn on Drill down option. To see all circulations for all grade levels across the entire district, use the Go to the next level in the hierarchy option.
To customize your view:
To view the data in a way that's most helpful to you, such as by excluding a data point, changing a graph to a table, or exporting it to Excel, use any of the available
To narrow the report to only the data you want to see, use any of the available widgets and filters.